TI InterActive!™ A Teacher's Best Friend?
Stephen Arnold
Download in PDF format
When was the last time you set a test or assignment that involved formulas, mathematical symbols, lists of data, graphs - any of the "bread and butter" of mathematics and science teaching? Did you struggle with equation editors, cutting and pasting from graph plotters or spreadsheets, working hard to present your questions in a clear way? Wouldn't it be great to have a word processor that made presenting mathematics and science easy?
TI InterActive!™ does all of this and more! A word processor with integrated mathematical capabilities, able to do everything a graphic calculator can (including symbolic computer algebra, like the TI-89 or Voyage™ 200), this package also includes an integrated spreadsheet and web browser. In addition to the normal "word-processor" menu options, this tool offers the ability to link directly, not only to Texas Instruments graphic calculators, but also to data loggers. This is a powerful partner for both teachers and students of mathematics and science.
Getting Started
Top of Page
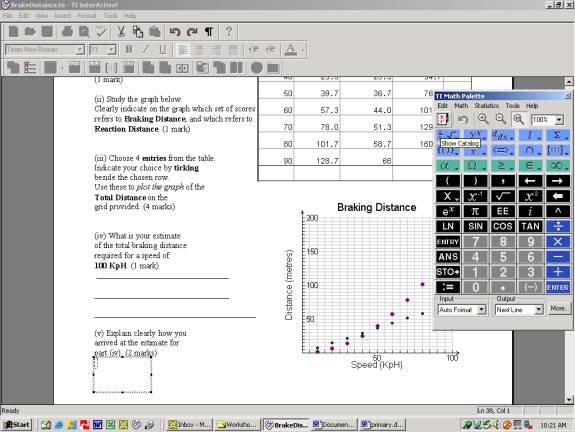
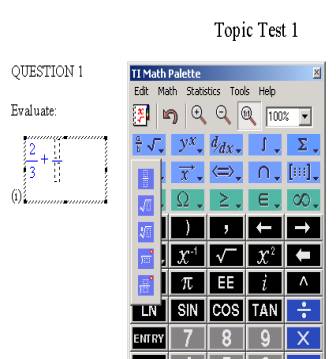
Top of PageAt the heart of TI InterActive!™ lies the Math Palette (or MathBox), which can be called up at any time using CTRL-M, or by using the INSERT menu. In this way, the user can switch easily between text and symbols. Input and output can be controlled, so that results of calculations can be hidden or displayed, as desired. After inserting a MathBox, it is a simple matter to create formulas and mathematical symbols: anything from fractions, roots and powers to matrices, derivatives and integrals. All forms of special notation are available, including Greek letters and the special characters so often needed for technical writing. Drop-down menus provide easy access to the wealth of type-setting options, while extensive “Math” and “Statistics” menus provide access to dozens of operations and functions.
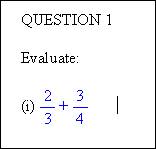
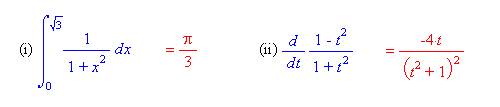
Consider the first example shown. After creating the topic test headings, it is a simple matter to create a fraction addition question, using the fraction template (or by pressing CTRL-f). Click anywhere outside the MathBox to display the result (in the example shown, the output is hidden, and the baseline of the mathematical expression is justified with the text. Of course, it is also easy to show the result of the calculation (here, with output displayed on the same line as the input). It is then a very small step from arithmetic to algebra and on to calculus with such a tool.
All of the features we have come to expect from our graphic calculator may also be found. Whether for function graphing (or parametric, polar) or the many available stat plots, or even just to place a nice empty graph screen into a test – this makes the process easy.
Statistical data is even easier. Either by entering values directly into the list editor (or spreadsheet), or linking to a calculator or data logger, statistic plots are readily available with a click of an icon! The data shown below was collected using the CBR motion detector from a student attempting to simulate a simple sinusoidal motion.
A Step-by-Step Introduction
Top of PageTop of Page
1. To use Math Boxes to perform calculations:
In the document, position the entry cursor where you want to insert the Math Box. Then:
1. Click Math Box icon
on the document's TI InterActive! toolbar (or click Insert->Math Box).
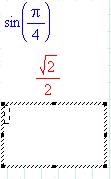
2. In the Math Box, type sin(pi/4) and press Enter.
Notice how your entry is changed into a two-dimensional form, and pi is converted to Œ.
A new Math Box is created automatically.
3. To multiply the previous answer by 8, use the variable ans to recall the last answer. In the second Math Box, type ans*8 and press Enter.
To cancel the new, empty Math Box, press Esc on the keyboard or click outside the Math Box.
Tip: To get decimal answers such as .707107 and 5.65685, respectively, either:
· Use a decimal point in your entry, such as sin(pi/4.)
– or –
· Change the Math Box's mode to set Computation = Approximate.
2. To create and explore a simple graph:
In the document, position the entry cursor where you want to insert the graph. Then:
1. Use the menu bar or the Graph
toolbar button to insert a Y= graph.
2. To use the menu bar, click Insert
Graph
Y=.
3. To use Graph
on the TI InterActive! toolbar, click the button. (The image on the button changes according to the last graph type you inserted. The Y= graph is the default. If a different image is shown, click
beside the button and then click the icon for a Y= graph.)
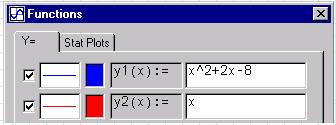
The Graph window and the Functions window appear. The entry cursor is in the box beside y1(x) on the Functions window.
2. In the y1(x) function box, type x^2+2x-8 and press Enter.
3. In the y2(x) function box, and type x and press Enter.
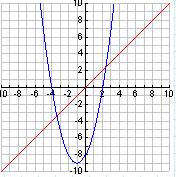
Each time you press Enter, the curve for that function appears on the Graph window.
Click
on the Graph window (or click File
Save To Document) to save the graph. Both the Graph window and Functions window close, and the graph appears in your document.
To make changes or explore a graph in a document, you must first open it. For example, suppose you want to calculate a zero.
4. Double-click the graph to open the Graph window and Functions window.
5. Click
on the Graph window (or click Calculate
Zero).
The dialog box shows the function used for the calculation. You can select a different function. Also, if there are several zeroes, you can set limits and a guess to specify a particular zero. For this example, use the default settings.
6. Click Calculate.
A cursor on the Graph window moves to the calculated zero point, and its coordinates are shown on the dialog box.
7. Click Cancel on the dialog box to close it.
A wide variety of graphing features are available on the Graph window and Functions window. You're encouraged to try them out.
More Advanced Features
Top of PageTop of PageOne way to obtain an overview of the capabilities of TI InterActive!™ is to briefly check each of the icons in the toolbar.
1.
The MathBox button closes the current MathBox (or Graph, or List, etc) and inserts the result into the document. The Mode Settings button controls the properties of the document.
2.
The Graph button (note the arrow – specific graph types can be chosen here) and Table of Values.
3.
The List Editor, Matrix Editor and full SpreadSheet.
4.
Stat Calculation tool, Inferential Statistics (Tests and Intervals) and the Slider (for animating function values: just enter an animation variable, say “a”, then define a graph or table with a function containing “a” and by moving the slider, the animation will occur!)
5.
The Calculator Data Transfer, Screen dump and the QuickData tool (for importing data directly from a data logger).
6.
The Web Browser button opens the full browser, which supports extracting data directly from a web page and inserting into lists. The document may also be emailed.
Have fun!

![[image]](./TII_files/image011.gif)
![[image]](./TII_files/image012.gif)
![[image]](./TII_files/image013.gif)
![[image]](./TII_files/image014.gif)