Home ←TI-Nspire Authoring Support ← Creating Interactive Documents using Spreadsheets and Graphs
Creating Interactive Documents using TI-Nspire™ 2
Spreadsheets and GraphsCompass Learning Technologies, AustraliaDownload an Interactive Sampler.
Have you been seeing TI-Nspire documents doing some surprising things lately? Text and other objects appearing and disappearing under different conditions? Have you been wondering just how this is achieved, and want to include some of this "magic" in your own TI-Nspire documents? These secrets are revealed here and you can begin to make these new authoring skills your own!
TI-Nspire documents offer powerful opportunities for teachers and students to create and communicate mathematics. Since the technology offers the possibility of dynamic interaction, then these documents, where possible, should be designed to engage the students actively in doing and exploring the mathematics they are seeking to learn. TI-Nspire is ideally suited as a platform for the development of such live learning experiences, and this discussion introduces some ways in which teachers may begin their development of such interactive documents.
Of the five working environments available within TI-Nspire (Calculator, Graphs & Geometry, Lists & Spreadsheet, Notes and Data & Statistics), two may be considered to be static in the sense that the action available to the user is unidirectional: a mathematical input is entered and an output is presented to the user as a result. Both in Calculator and in Notes, mathematics may be entered and evaluated, but without the option to then act upon the output and see a corresponding change in the input.
The other three environments, however, offer varying degrees of interaction and, indeed, customization: the extent to which the user may alter the layout, purpose and design of pages within Data & Statistics is quite limited: while it is certainly a dynamic interactive environment, it is designed to carry out quite specific tasks in set ways. Sliders and text may be added to the screen, and this is the extent of customization possible in this environment.
The Lists & Spreadsheet application is open to greater adaptation, in purpose if not in layout, while the Graphs & Geometry environment is almost completely fluid in being open to user-specified layout, design and, indeed, purpose. The G&G screen is like an interactive whiteboard which the teacher or student may use to present text, graphs, mathematics and more; in many ways, it is limited only by the imagination of the user. We will begin by considering some ways in which Lists & Spreadsheets may be used creatively, and then spend more time learning how to use Graphs & Geometry to more of its full potential.
Spreadsheets and More
At the heart of the "magic" that can be used to make things appear and disappear in TI-Nspire lies the "when" command, which takes on some surprising power within both L&S and G&G environments. Its syntax is simple: when(something happens, do me if the condition is true, [and optionally do me if false, or even do me if you don't know what to do].
For example, suppose we are interested in teaching students how to subtract positive and negative integers. If "x" represents the integer we wish to subtract, say from 2, then we could design a spreadsheet layout which might look like the following:

In cell A1, we have a text statement, "2 -" and in cell B1, the value for our variable "x" (currently 3). Notice that the cell is gray - the contents of this cell have been linked to the variable "x" using either CTRL-L or by pressing the VARS key and storing to "x".
Cell C1 has " =" entered as text (always using "" when entering text) and cell D1 has the value of the expression "=2 - x" as required by the original question.
So far, so good - but what would we like to see happening here? For students to learn how to subtract a negative integer, I would like them to see an expression such as "2 - (-3) = 2 + 3 = 5".
Cells A1, B1 and C1 remain the same, but something has changed in cells D1 - G1. Let's have a look at what is happening in cell D1: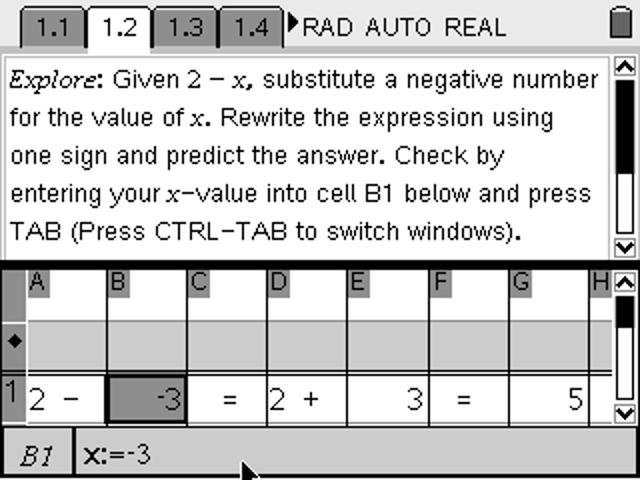
Here is our "when" statement at work: when the value of "x" is less than 0, then show the text "2 +", otherwise, just evaluate the expression "2 - x". What do you think controls cell E1? When x < 0, we would like to see the absolute value of x, otherwise just show nothing (""). The same type of structure works for cells F1 and G1.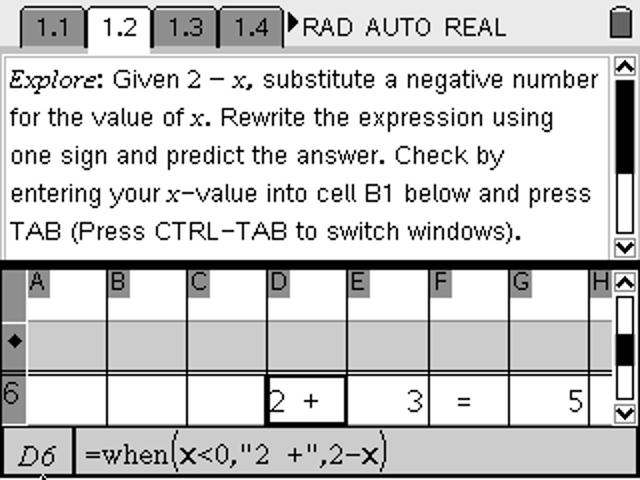
I chose to put these commands down in row 6 of the spreadsheet rather than in the actual cells D1 to G1: this prevents the user from accidentally erasing or changing these commands if and when they land in these cells; instead, in cell D1, I simply put "=D6" which will just display the contents of cell D6, as required.
This ability to control what is calculated and what is actually displayed in the spreadsheet is a very useful and versatile feature which can be used in a variety of contexts. For example, in the number line explorer, a point whose x value is linked to a variable is moved along a number line and different representations are displayed in the spreadsheet.
 Here we are using a different form of the "when" command, which is just the simplest form for a piecewise function. In a piecewise function, we can define several different conditions and the results which follow from each.
 In cells l1 and m2 we have split the current value for the rational number into its whole number and fractional parts respectively. Then we may consider the various cases: if the fraction part is zero, then show nothing, if the fraction part is non-zero and the whole number part is negative (less than -1) then show the absolute value of the fraction part, or if positive, then just show it as it is.
It is important to note, before we leave our Lists & Spreadsheet behind, an important difference between the CAS (computer algebra system) and the non-CAS versions of this application. The CAS version will quite happily accept algebraic (symbolic) expressions in its cells, and quite happily act upon these. Thus, we can enter a valid command such as =solve(x^2-x-1=0,x) into cell A1, and the output will be the exact form for the solutions of this quadratic. Thus we can use CAS L&S to display algebraic expressions and equations, if desired. Here we have equations stored to variables and, as students enter each step of the equation solving process, a simple function checks what they enter against the previous entry and verifies that they have not made an error. Even with the non-CAS form, however, quite useful algebraic work may be achieved in this often-overlooked application.

A Fully Flexible Working Environment
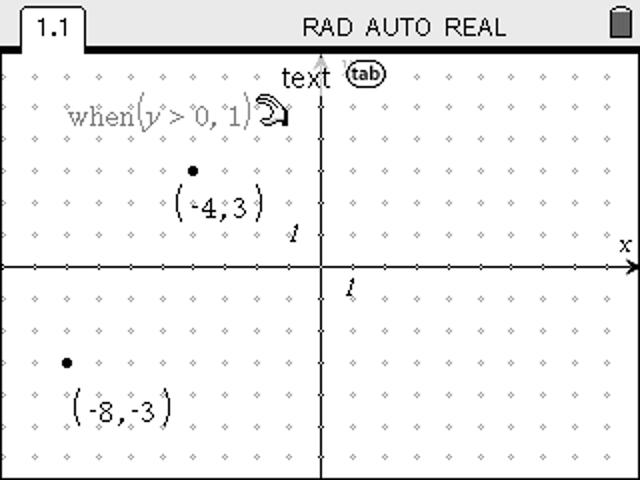
Top of PageWhile great things can be achieved within L&S, it remains limited in terms of layout - there is not much we can do about the headers and cells (at least at present). For total freedom in layout and design, there is nothing quite like the Graphs & Geometry environment - hide the axes (or work in Plane Geometry view) and position text, algebraic forms, graphs or even constructions and animations wherever you want them.Without trying to be too ambitious, we will see how easy it is to make things appear and disappear according to conditions that students can control. We begin with a simple example: a free point which will generate "Positive" when above the x-axis, and "Negative" when below.

Begin with a Graphs & Geometry page, and to make things simpler, turn the grid on, using MENU>View>Show Grid. Drop a point using MENU>Points & Lines>Point On. Display its coordinates using either MENU>Actions>Coordinates & Equations, or by right-clicking (CTRL-MENU on the device) on the point.
Now decide where you want your message to appear, and drop a point there with its coordinates also shown. Here our message will appear in the bottom left corner, at point (-8, -3). These coordinates will serve as the centre of a circle, whose radius will be controlled by a "when" statement.
Use the Text Tool (MENU>Actions>Text) at some clear space on the page to place your first "when" statement: "when(y > 0, 1)", as shown.
 Now choose MENU>Actions>Calculate, and you be asked for the value for "y" - click on the y-coordinate of your control point, and then click somewhere free to drop the resulting value. If, as shown, your control point lies above the y-axis, this will be "1"; if not, then it will say "undef". Move to a place where this value is 1.
Choose MENU>Shapes>Circle, click once on the output of our calculation, ("1") and then on the point where you want your label to appear (here it is the point (-8, -3). Immediately type the word "Positive". Note that this is the circle that is being labelled, NOT the point.
Test your "dynamic text" - grab your control point and drag it below the x-axis: your circle and its label will vanish as the output of the "when" statement becomes "undef".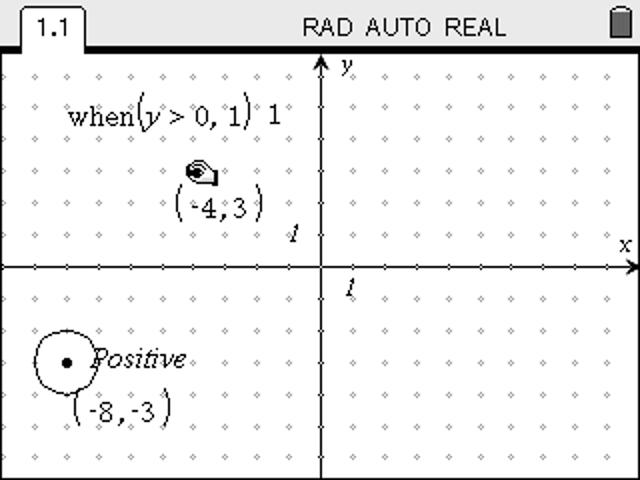
Finally, change the when statement so that the output is 0.01 instead of 1 - do not try and edit the actual output number - you must edit the "when" statement. The circle will appear to disappear and all that you will see will be the centre point and the label (if y > 0).
NOTE: It should be noted that, because of the approximate nature of the Graphs & Geometry environment, if you wanted to use a particular value for your condition (say, when(x = 0, 1)) THIS WILL NOT WORK! (equality as a condition works just fine in Lists & Spreadsheet, but not in G&G). Instead, we need to "sneak up" on the value in question - in fact, set a "delta neighbourhood" around our target value! So if we want a reaction when x = 0, we could use the command when(abs(x)<0.001,1); if we want a reaction when, say, x = 5, we might use the statement when(abs(x-5)<0.001,1). This has the advantage of allowing you to set the level of precision that is appropriate for your particular context.
You can now hide the when statement and the output (try right-click (CTRL-MENU) each and choose "Hide/Show").
 Repeat this process for the other condition: use text to place "when(y < 0, 1)", drag your control point below the x-axis, and use Calculate with the y-value of our point to output "1". Create a circle with centre at (-8, -3) and radius 1, label this circle "Negative", then edit the "when" statement to output 0.01 so that the circle appears to vanish. As you drag your control point up and down, you should see the message change from "positive" to "negative" and back again.
 To finish, hide everything except the control point, its coordinates (if desired) and the label. The actual point which serves as the centre of our two (very small) circles can also be hidden - OR use Attributes to make it as small as possible. Move the words "Positive" and "Negative" so that they correspond and cover the very small point you have left behind and you are set. By leaving that point visible, you can, if you wish, grab it and move it to another location easily and so control the layout of your page more readily. I might, for example, decide that I prefer my message to appear in the top right corner of the window - I can just grab the point and move it there and all will work from the new position.
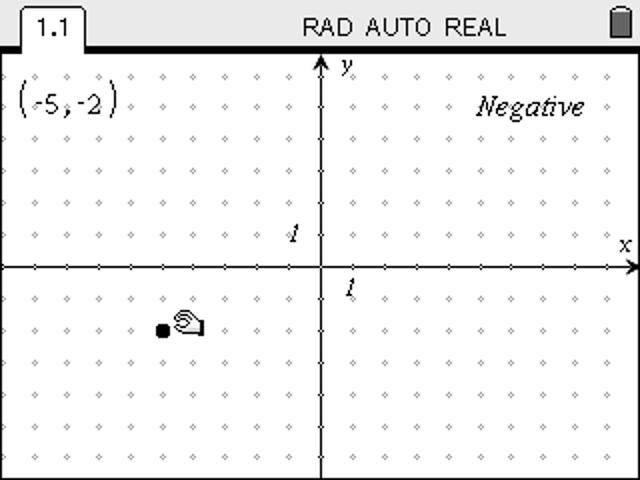 This is the essence of what we are calling "dynamic text" - simple, but very flexible. It is not restricted to text but can be applied to any geometric or even graphical objects that the user may wish to show or hide. It works because of the undefined output - any object which depends upon that output will appear fine when the output is a number, but will simply vanish when it is undefined. Note that this is different to the way that it works in L&S, where the output can be text (including a blank "" which causes cells to display nothing). Within Graphs & Geometry, the output of a when statement cannot be text, only a value or "undef".These methods will work for any text that is static - you can control the appearance and disappearance of numbers, words, even whole sentences. You can even offer conditional feedback that varies as required.
 The control of variables is a much more complex process, since they must somehow be linked to the appearance of a geometric object in order to avoid the appearance of the "undef" result. At this stage, the most effective means of making a variable value appear and disappear lies in constructing a segment whose slope is the same as the value you wish to display. The steps for such a construction would take another complete document, and are suitable for the next "advanced" stage of this learning process.
©2009 Compass Learning Technologies ← Home ←TI-Nspire Authoring Support ← Creating Interactive Documents using L&S and G&G